
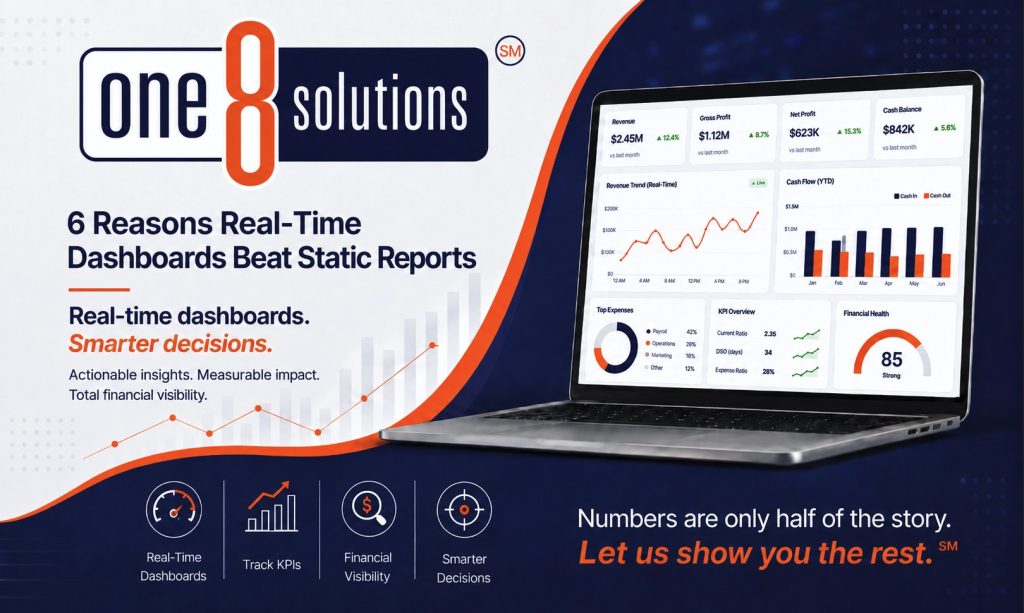
6 Reasons Real-Time Dashboards Beat Static Reports
How Better Visibility Leads to Better Business Decisions
Sales are rising, your team is hard at work, and new projects are underway. Customers are reaching out, so everything seems positive. But then payroll is due, some big customer payments are late, and material costs are higher than planned. Suddenly, cash feels tighter than expected.
Sound familiar?
This is a common frustration for business owners. The business looks healthy, but something feels off. Revenue is up, but cash flow is unpredictable. Profits seem strong, but margins are shrinking. The answers are in your financial data, but finding them often means sorting through reports that are already out of date.
The problem isn’t a lack of information. Most businesses already have the numbers. The real challenge is seeing what matters.
For years, business owners used static financial reports to understand how things were going. After month-end, reports were created, and decisions were made using outdated data. These reports are still useful, but businesses today need more than just a monthly update.
They need to see what’s happening as it happens. That’s why more companies are switching from static reports to real-time dashboards. In our recent article, “5 Strategic Priorities to Guide Your Finances in 2026,” we talked about how financial visibility is key to making smart decisions. Before you can boost profits, improve cash flow, or plan for growth, you need to clearly see where your business stands right now. Real-time dashboards help make that visibility possible.
1. Real-Time Visibility Beats Month-End Surprises
Most financial problems don’t appear overnight.
Cash flow issues usually begin with slower collections. Margin erosion often starts with rising labor or material costs. Revenue declines typically show up as gradual trends before they become obvious problems. The issue is that many business owners don’t see these warning signs until month-end. By then, valuable time has already passed.
A dashboard changes this. Instead of waiting for reports, you can watch key numbers as they happen. Revenue, expenses, profits, cash balances, receivables, and payables all show up in one place, making it easier to spot trends before they turn into bigger problems.
Think of it like this: a static report is like a photo, while a dashboard is like a live video. Both give you information, but a dashboard lets you react faster.
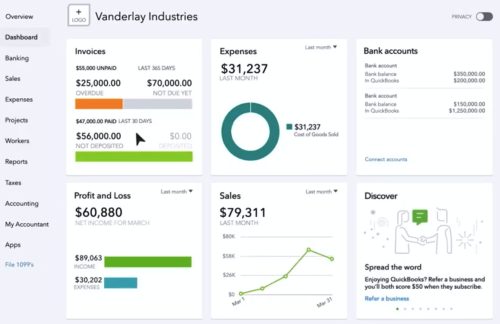
2. Performance Center Brings Your KPIs Together
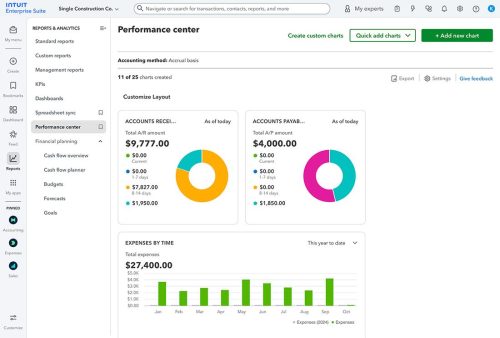
One of the most useful features in QuickBooks Online Advanced is Performance Center. It acts like a command center for your business.
Instead of juggling different reports and spreadsheets, Performance Center lets you build custom dashboards that show your key financial and operational numbers all in one spot.
Before you build a dashboard, it’s good to know the difference between a KPI and a trend. A KPI (Key Performance Indicator) is a business number you can measure, like revenue, profit margin, accounts receivable, or invoice volume. A trend shows how that number changes over time. You can think of the KPI as the score and the trend as the direction the score is moving. Both are important. A healthy business isn’t based on just one month’s results, but on knowing where things are going.
For some businesses, that may mean tracking revenue growth, gross profit, net income, and cash flow. For others, it may mean monitoring profitability by project, department, location, or service line.
A construction company can compare project performance. A professional services firm can monitor utilization and margins. A manufacturer may want to track profitability by product line, while a multi-location business can evaluate performance spanning offices or territories. Service-based companies may choose to group dashboards by service offering to identify which areas of the business are generating the strongest returns.
Performance Center also allows users to group and filter data by class, location, vendor, product, service, customer, or project. That level of visibility helps business owners go beyond simply knowing what happened and begin understanding what is driving the results.
Most small to mid-sized businesses should begin with a handful of core KPIs:
- Revenue
- Gross profit margin
- Net income
- Cash flow
- Accounts receivable aging
- Accounts payable aging
- Budget versus actual performance
A common mistake is trying to track too much at once. Start with a few key metrics that matter most to your business. As you get more comfortable with reporting, you can add more details to your dashboard to answer specific questions.
A simple dashboard you check often is much more useful than a complicated one that no one looks at.
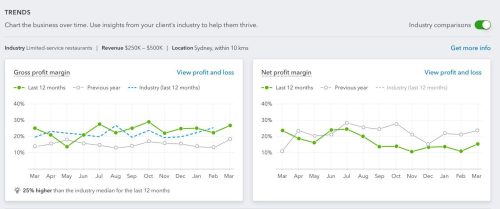
3. Trends Tell a Story Before the Financial Statements Do
One of the biggest benefits of dashboard reporting is seeing trends. Many business owners focus on monthly results, but trends often tell a more important story.
Imagine that revenue has increased for three consecutive months. On the surface, that’s good news. But what if gross profit is trending downward at the same time? Or accounts receivable balances are increasing faster than sales?
These trends might point to pricing problems, higher costs, or collection issues that need attention. Without a dashboard, these changes can stay hidden in separate reports.
With a dashboard, it’s much easier to spot them.
Performance Center gives businesses the ability to create trend charts that help visualize changes over time. Businesses using QuickBooks Online Advanced can also take a deeper look at performance through KPI Scorecard. While dashboards provide a visual overview of performance, KPI Scorecard allows users to analyze performance across custom date ranges, comparative periods, and rolling 12-month views.
Together, these tools help business owners go beyond just looking at numbers and start spotting patterns that lead to better decisions.
For a deeper discussion on financial visibility and proactive decision-making, we explored this topic further in our article, “Why Smarter Accounting Is a Game Changer for Your Business.”
4. Dashboards Create Visibility. AI Helps Explain What You’re Seeing.
Artificial intelligence is getting a lot of attention these days. But many business owners aren’t sure where its real value lies.
Some people think AI is taking over financial analysis. In fact, the opposite is true. Dashboards are still the main tool because they show how your business is doing. AI just makes dashboards more helpful by explaining what the numbers mean.
Dashboards create visibility. AI helps explain what you’re seeing. Recent enhancements within QuickBooks Online Advanced include Finance AI and Intuit Intelligence capabilities that can summarize financial performance, identify unusual activity, highlight anomalies, and surface insights that may otherwise remain unseen.
Imagine opening your dashboard and noticing a decline in profitability. The dashboard tells you something changed. Finance AI can help identify which expense categories increased or which areas of the business are causing the shift.
Or perhaps cash balances have started declining. The dashboard shows the trend. AI can help surface potential causes and direct your focus on the areas that deserve further review. This technology saves you time searching for answers. It doesn’t replace financial know-how from an expert. It just helps you find the right information faster.
According to Intuit, Finance AI is designed to provide business owners with financial summaries, anomaly detection, forecasting support, and actionable insights promptly within QuickBooks Online Advanced.
5. Better Dashboards Lead to Better Cash Flow Management
Cash flow remains one of the most important metrics in any business. And it’s often one of the least understood.
Many business owners pay close attention to revenue and profits but miss the things that affect daily cash flow. The result is a business that looks good on paper but always feels squeezed when it’s time to pay bills. A good dashboard can help fix that problem.
When receivables, payables, cash balances, and revenue trends are displayed together, business owners gain a much clearer understanding of how money is moving through the business. Instead of asking, “Why is cash tight?” after the fact, you can begin identifying possible issues before they become problems. We discussed this concept in greater detail in our article, “Time for a Mid-Year Financial Checkup for Your Business,” where we explored how forecasting and cash flow visibility help businesses make more informed financial decisions.
The most successful dashboard users don’t just set it up and forget it. They make a habit of checking it regularly. Some owners start their day by quickly checking the dashboard. Others review KPIs and trends in weekly meetings. The point isn’t to look at charts all day, but to build a routine that helps you catch issues, find opportunities, and make smart decisions before small problems grow.
When you can see what’s happening, you can plan better. And better planning means fewer surprises.
Quick Tip: Can’t Find Performance Center or KPI Scorecard?
Some QuickBooks Online features can be hard to find in the menus. If you can’t locate Performance Center or KPI Scorecard, try using the QuickBooks search bar at the top of the screen. Searching by the feature name is usually the quickest way to get there.
6. Technology Is Powerful. Interpretation Is What Creates Value.
This is where many businesses hit a roadblock. They buy software, build dashboards, and get more data, but still aren’t sure what to do next.
It’s helpful to know if margins are shrinking, but it’s even better to understand why. It matters if cash flow is tight, but knowing what to do about it is what really counts. That’s where controller-level accounting and business advice make a difference.
- A dashboard can show that gross profit is shrinking.
- A trend chart can reveal whether the issue has been developing for weeks or months.
- AI can identify where the changes are occurring and surface anomalies that deserve attention.
- A controller can investigate the underlying causes.
- An advisor can help determine the best course of action.
This process turns visibility into understanding and understanding into action.
At One 8 Solutions, we help business owners move beyond bookkeeping and reporting. As a Client Accounting Services firm, we provide bookkeeping, accounting, controller-level oversight, financial reporting, workflow management, budgeting support, cash flow visibility, and business advisory services intended to help owners understand what their numbers are telling them and what to do next.
Technology gives you information. Experience gives you perspective. Together, they help you make better business decisions.
Seeing the Bigger Picture
The future of financial reporting isn’t about making more reports. It’s about giving you more visibility.
Real-time dashboards help business owners monitor performance, identify trends, manage cash flow, and make decisions with greater confidence. Tools like Performance Center, Finance AI, and Intuit Intelligence are making those insights more easily accessible than ever before.
The businesses that benefit most aren’t always the ones with the most data. They’re the ones who know how to use their data to take action.
“Numbers are only half the story. Let us show you the rest.”
Schedule a complimentary Zoom meeting with One 8 Solutions to discuss how real-time dashboards, controller-level accounting, and business advisory services can help you gain greater visibility into your business and make more confident decisions.
